NICKEL:PATTERN INTERPRETATION
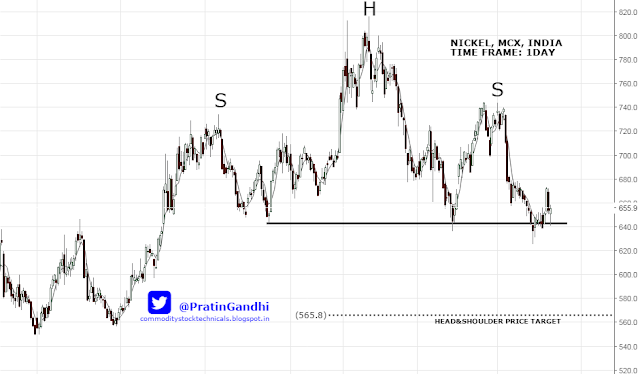
Nickel price chart formed 8 months long Head & Shoulder reversal chart pattern with very strong horizontal support standing near 640 levels. Evidence of H&S at the top can be considered as a bearish signal. Almost eight months long H&S top price target stands near 565. A short trade can be entered at the weekly close below 640 levels.
From the charting perspective, there are several more bearish interpretation of the current price action. As per wave principle, an Impulse of five waves and a correction of three waves have been completed and another five wave impulse or a set of two correction waves can be anticipated.


Comments
Post a Comment