Posts

Showing posts from October, 2015

HIGH PROBABILITY OF TRADING SETUP-2(ALUMINIUM)

Image
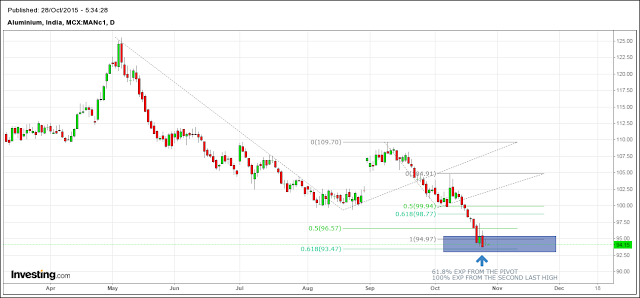
Hear i started blog for those who are interested in Commodity trading with technical analysis. In this blog i usually post two types of articles. First is Commodity technical overview in which i explain probable market position with technical analysis which helps Commodity traders a lot to plan a strategy for next few months and second type of article is the high probability trading setup which has been isolated after deeply researched on both time and price parameters of that particular Commodity.I display these high probability setup article only when the time and price objective has already been met to take a position in market to long or short side on the  same trading day or upcoming two three days. Hear i am displaying Aluminium chart that has very high probability to go in up side DISCLAIMER : TRADING IN FUTURE MARKET IS EXTREMELY RISKY, AND IT DOESN'T SUITABLE FOR EVERYONE.

HIGH PROBABILITY OF TRADING SET-UP-1 (CRUDE OIL)

Image
As we discussed in the article of CRUDE OIL OVERVIEW , If the last low is the end of Wave-5 than current upside must be a correction against the big down trend. Lets take this article as an Objective  and Hear I am representing some important set up in Crude Oil to take a long position in, Crude OIL price will face very strong support levels in upcoming two-three days from where it will defiantly bounce back.  AS per my opinion, If this support level  will be rejected by the Market, the price can go more deeper to the chart for few more weeks. Lets check out what are the supports and see what does the price reaction over there…………

CRUDE OIL TECHNICAL OVERVIEW

Image
Hello traders!!! Hear I am representing some charts of your favorite commodity Crude Oil which are researched based on elliot’s wave theory, after reading this article you will get the probable market position and it will defiantly help you to trade in Crude Oil for upcoming few months I used the term probable as nobody can predict the market activity in advance, nobody can guaranty you for any forecasting regarding the market activity Trading is the business of probabilities, so engage only in those trades  which have very high degree of success opportunity based on trading structure. Hear is the technical analysis of Crude Oil, let’s have a look   As per the theory price trade into the direction of trend unfolding five waves, as per this chart five waves have already been completed. Remember if the last low(probable end of fifth wave) break in upcoming days than we can say that  there is still down side in crude left up to the another price objective where wave 5 may

NICKEL TECHNICAL OVERVIEW

Image
The aim of this article to teach people who interested in trading with technical analysis that is Elliot’s wave and other technical indicators, it also helps to the professional traders and the students of Elliot’s wave,  It also teach people the probable  market position of Nickel and what should be the trading strategy during this time and how to approach the market. Hear I am presenting Nickel (mcx) charts and explaining you the market position , See how Elliot’s wave analysis works in freely trading market. As per the  theory price moves in five waves in the direction of trend, the chart displayed below is seems like un even moves and one can confuse to trade for intermediate to long term vision.   Lets make it more clear the probable market position by doing the wave counts, hear is the another picture which is self explanatory. As seen in the above chart the wave 4 th is being treaded, and it seems like choppy and range bound structure as per

Follow me on Twitter @PratinGandhi