Posts

Showing posts from March, 2017

COPPER:WAVE ANALYSIS

Image
The Expanding Triangle. The above picture can be the real-time example of Expanding Triangle. Copper is trading sideways since January 2017 Right now The "e" wave is being traded and might end up near 382-384 levels. The major trend is up and it might be initiated after completing the "e-wave"

Crude Oil:Wave Analysis

Image
The graph given below can be the most probable wave count for Crude Oil (MCX India) in the Daily timeframe. The major trend of Crude Oil is likely to be up.  The current trend might be down and might be going towards 3440-3400 levels. The sub-wave (B) can be ended near 3440 to 3400.Check these levels if Price continue to go down Check the breakthrough at upper line of the consolidations if price go upward without testing the given levels   

Aluminium- Wave analysis

Image
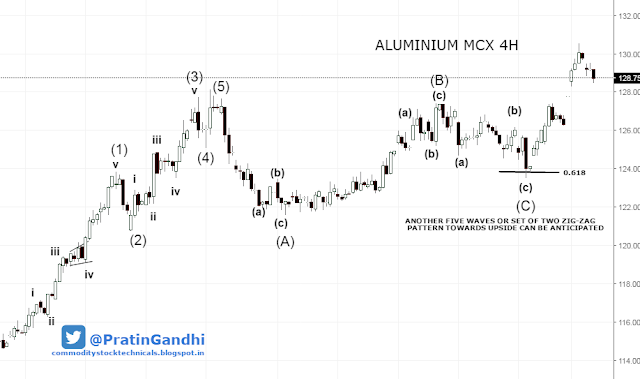
The picture given below can be the most probable wave count for Aluminium (MCX India) in the 4H timeframe. Aluminum is in up trend and heading towards 132-135 levels. Five waves or set of two zig-zag patterns can be evident very soon Every dip can be a good opportunity to buy. 

Follow me on Twitter @PratinGandhi