Elliott wave analysis:Aluminium
Trading using wave principle is much advantageous and has numbers of other benefits than other indicators that usually fall short to understand the current market activity over a larger degree trend. The wave study also determines the current trend of any instrument and gives the idea whether the trend has just initiated or being traded in intermediate stage or it has been matured.
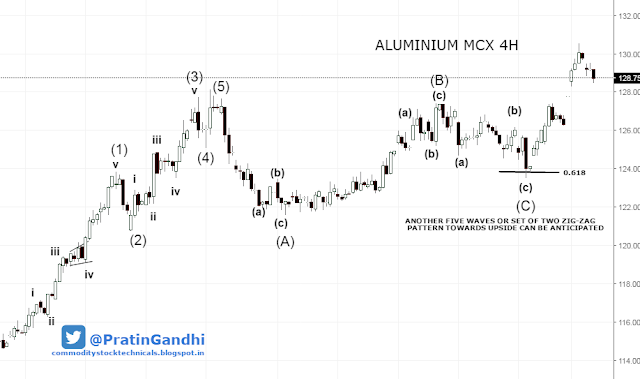
The next graph is the classic example of Aluminium in which high degree of complexity is simplified by wave principle.
The next graph is the classic example of Aluminium in which high degree of complexity is simplified by wave principle.
See the last high which was made on 23rd Nov 2016 and I marked as the label (Y). I anticipated that the price will come down after testing the level around 122.15 and also expected the trend will permanently change and it will not come back to taste 122.15 again. I explained in the next chart why I was considering 122.15 level was the reversal point.

Trading with Elliot’s wave principle is extremely subjective so we need to collect information, clues, and messages by analyzing the market over the time. The next chart represents some clues which I had noticed during the period and I was clear about something was going wrong.

It is concluded what we had considered in the first chart and labeled as wave-(Y) was not the real end of wave-(Y).It is still being traded and here are some key levels that need to be observed. This article is also indicating that all wave counts are tentative and we are also allowed to change the count whenever the market will prove your study wrong.


Comments
Post a Comment