Elliot's wave analysis: Crude oil
Elliot's wave analysis can be a great instrument for alert traders.The basic of Elliott wave principle is that most trend unfolds in five wave structures in the direction of the trend and three waves in the opposite direction of the main trend.
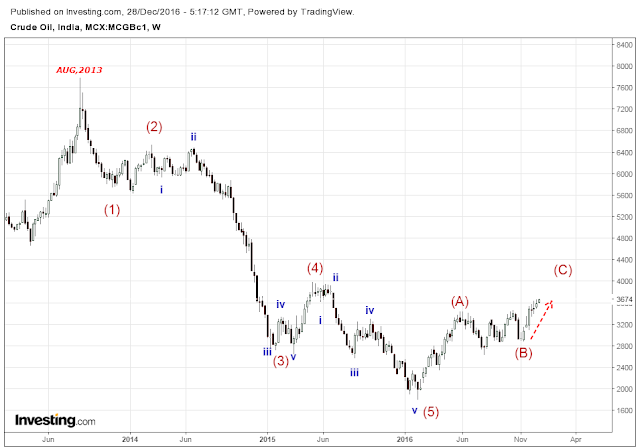
The first chart shows the bigger picture in the weekly time frame.
let's start with significant high of Aug 2013 which can be termed as a start of Elliot's wave cycle.A very big bear Elliot's wave cycle is being unfolded and probable wave count can be like this.
There are certain rules and guidelines associated with Elliot's wave analysis that helps to identify the wave structure.Take a look at the given pictures individually and confirm the whole structure is Elliot's wave cycle.


The reason behind this clarifications is making you aware of footprints of past price action is actually indicating a presence of Elliot's wave cycle and it is yet not finished.
Once a five wave pattern completes in the main direction of the trend, the entire sequence should be corrected by a pattern either simple or complex pattern.
The next chart represents the correction after a bear five-wave cycle.

The market may be in the correction zone over a steep downtrend, but once the market gets beyond a simple ABC correction than it is usually not a specific pattern interpretation.In such cases, we shouldn't try to force a complex count to identify something that is not reliable.
After reading this article one can easily grasp the exact market position and the current market sentiment of Crude oil.
The first chart shows the bigger picture in the weekly time frame.
let's start with significant high of Aug 2013 which can be termed as a start of Elliot's wave cycle.A very big bear Elliot's wave cycle is being unfolded and probable wave count can be like this.

There are certain rules and guidelines associated with Elliot's wave analysis that helps to identify the wave structure.Take a look at the given pictures individually and confirm the whole structure is Elliot's wave cycle.


The reason behind this clarifications is making you aware of footprints of past price action is actually indicating a presence of Elliot's wave cycle and it is yet not finished.
Once a five wave pattern completes in the main direction of the trend, the entire sequence should be corrected by a pattern either simple or complex pattern.
The next chart represents the correction after a bear five-wave cycle.

The market may be in the correction zone over a steep downtrend, but once the market gets beyond a simple ABC correction than it is usually not a specific pattern interpretation.In such cases, we shouldn't try to force a complex count to identify something that is not reliable.
After reading this article one can easily grasp the exact market position and the current market sentiment of Crude oil.


Comments
Post a Comment