NICKEL TECHNICAL OVERVIEW
The aim of
this article to teach people who interested in trading with technical analysis
that is Elliot’s wave and other technical indicators, it also helps to the
professional traders and the students of Elliot’s wave,
It also teach people the probable market position of Nickel and what should be
the trading strategy during this time and how to approach the market.
Hear I am
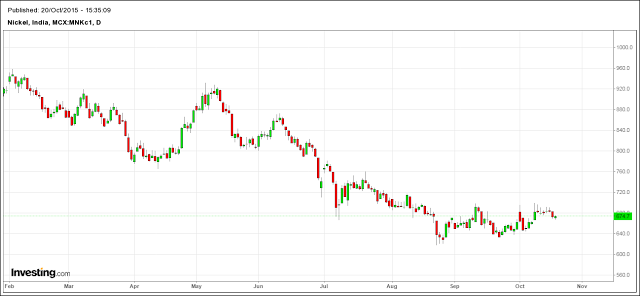
presenting Nickel (mcx) charts and explaining you the market position , See how
Elliot’s wave analysis works in freely trading market.
As per the theory price moves in five waves in the
direction of trend, the chart displayed below is seems like un even moves and
one can confuse to trade for intermediate to long term vision.
Lets make it
more clear the probable market position by doing the wave counts, hear is the
another picture which is self explanatory.
 As seen in
the above chart the wave 4th is being treaded, and it seems like
choppy and range bound structure as per its personality in Elliot’s wave theory
and the over all structure of all waves seems like complete text book example
but no, it is really freely trading market,
Now we
should take the position at or near the end of wave 4 for the 150-200 points
target that is wave 5 end , let’s see the next chart for the target.
Hear it can
be the probable nice targets for wave-5 end, just be patient ,take position and
wait and watch.


Comments
Post a Comment