Posts

Elliot's wave analysis: Crude oil
Image
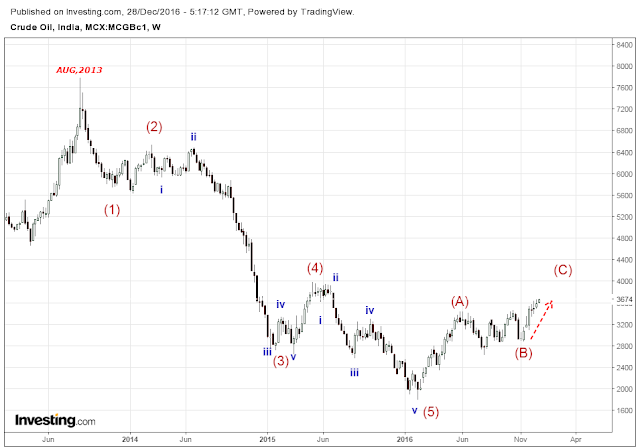
Elliot's wave analysis can be a great instrument for alert traders.The basic of Elliott wave principle is that most trend unfolds in five wave structures in the direction of the trend and three waves in the opposite direction of the main trend. The first chart shows the bigger picture in the weekly time frame. let's start with significant high of Aug 2013 which can be termed as a start of Elliot's wave cycle.A very big bear Elliot's wave cycle is being unfolded and probable wave count can be like this. There are certain rules and guidelines associated with Elliot's wave analysis that helps to identify the wave structure.Take a look at the given pictures individually and confirm the whole structure is Elliot's wave cycle. The reason behind this clarifications is making you aware of footprints of past price action is actually indicating a presence of Elliot's wave cycle and it is yet not finished. Once a five wave pattern completes in the mai...
History Repeats Itself: COPPER

Image
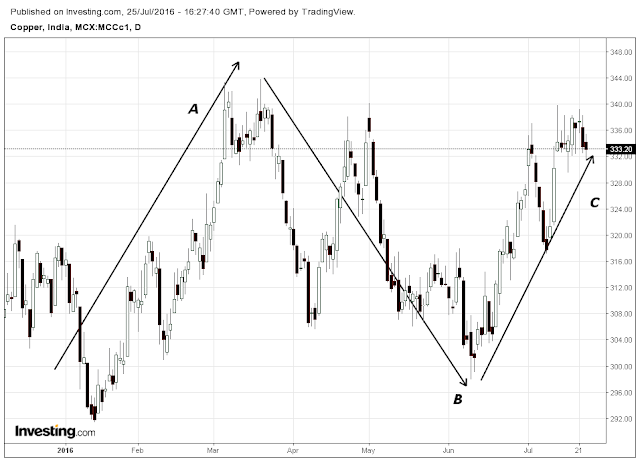
We all are very well aware of the basic principle of technical analysis is that the history tends to repeat itself. The crowd cannot change their motivation overnight it means the people are expected to react the same way to a certain situation as they did in past the same certain situation. If we think based on technical analysis context, the market is driven by the mass psychology. And the randomness of price movement in the market is the consequence of greed and fear, pain and pleasure. So sometimes price movement react exact the same way as it has reacted in past on particular occasion. Below is the copper daily chart representing three waves these are wave-A, wave-B, and wave-c .The pivot point or the start point of wave-A is 13th Jan 2016 and its price ranging from 291 to 343. After achieving 343 price level wave-B has started and it seems to be irregular flat correction structure. Now the low at 9th June 2016 is may be the end of wave-B and the same point can be considered...

HIGH PROBABILITY OF TRADING SET-UP IN NATURAL GAS

Image
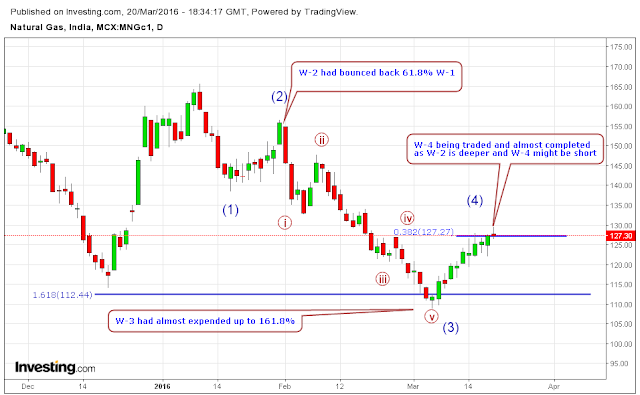
We all know that Natural Gas is trading deeper and deeper since FEB 2016.As per the current scenario it has still some down side left and current market position indicates a very high probability of trading set-up has already been established.  Hear i am representing a probable Eliot's wave structure that may have high chances of success    See the below picture which is self explanatory... In   picture you will see the probable wave count As per the above picture W-4 has completed or the reversal is very near. See the next graph for stop loss entry and target strategy

Crude Oil Technical Overview

Image
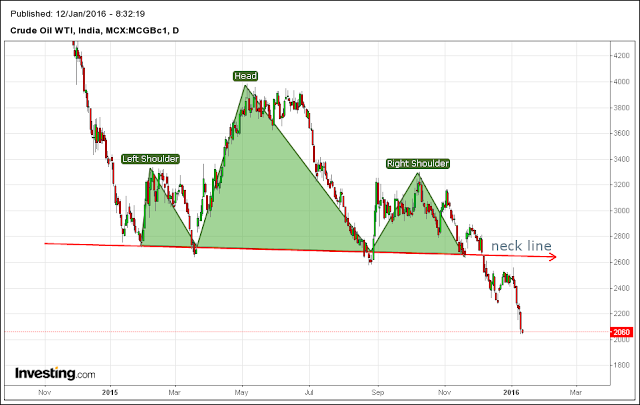
As we discussed in previous  Article  Crude oil technical overview  posted on 25th October 2015, in which i have explained about  probable Elliot's wave numbering and also discussed about formation of a Head and shoulder pattern which gives a very bearish implications. See the Crude price after breaking the neck line of the same H&S pattern.  Now the big question is..UP TO WHICH PRICE CRUDE CAN PLUNGE DEEP DOWN??  As we have discussed in previous crude article that the price is probably in the Fifth wave of big Elliot's wave down cycle so the end is nearer.. Now lets take a look on 5th wave and lets apply Elliot's  wave numbering forcefully  Now lets zoom into the wave 5th of 5th and see the probable wave count.  And now lets t...

AFTEREFFECTS

Image
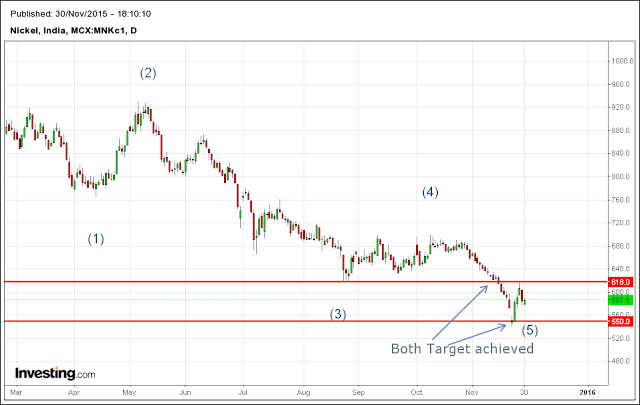
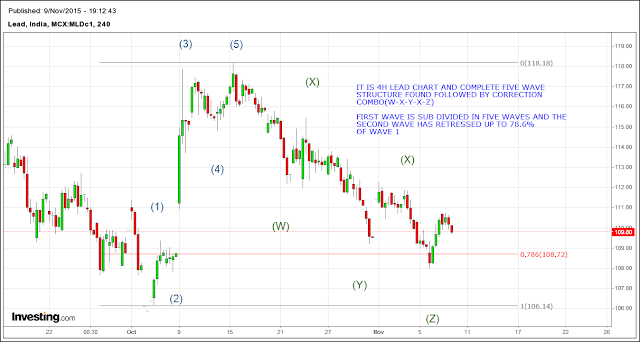
This post contains results of  Nickel overview and High probability of trading setup in lead which i have forecast last month as per ELLIOT'S WAVE technical research. In this blog i usually post three types of articles  1) Commodity Overview --that reflects the probable path of price of that particular Commodity  as per Elliott's wave research 2) High probability of trading setup -- that gives the oppotunity to take position in market with high probability of success  3) Aftereffects -- that shows results of above two king of articles weather it favors my forecasting Or not......... On the date of 20th OCT 2015 i posted in the article  Nickel Technical Overview   the 4th wave was under progress and the 5th wave was still to be unfold and I have given two targets for wave-5 probable end that is 618 and 550. See how nicely this both target has been achieved. The same way i published  HIGH PROBABILITY OF TRADING SETUP -3(LEAD)   ...

HIGH PROBABILITY OF TRADING SETUP -3(LEAD)

Image
Hello traders!! Wish u all a very happy Diwali and Prosperous New Year!! Hear i again bring to You a very high trading probability setup in LEAD with protecting Stop loss!! Today's article is really very important for me as very first time I'm going to dare to forecast 3rd wave in advance.. It has always been a dream of Elliott's wave trader to trade the third wave from its start. Take a look to this chart and hope for the best.......... DISCLAIMER : TRADING IN FUTURE MARKET IS EXTREMELY RISKY, AND IT DOESN'T SUITABLE FOR EVERYONE.

AFTEREFFECTS

Image
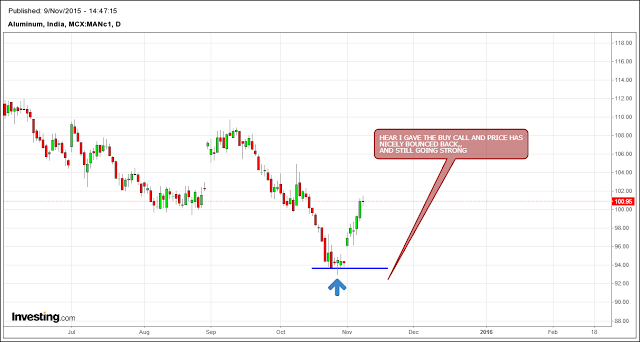
Hello everyone, Hope You enjoy trading with technical analysis and u also have taken benefit from the article high probability of trading set ups which i have published last week.. The main parpous  to publish this article (AFTEREFFECTS)  is to make people aware that technical analysis works nicely if u have worked well on it. Now let's check what is the outcome of the high probability of trading setups of Aluminum and Crude oil I published the article on 27th Oct,2015 HIGH PROBABILITY OF TRADING SETUP-2(ALUMINIUM)  in which i gave the buy call..and see how nicely the price bounced...  The same way i indicated the strong support for crude oil in this article HIGH PROBABILITY OF TRADING SET-UP-1 (CRUDE OIL)  posted on 26th oct 2015..and crude price has nicly reacted on this 

Follow me on Twitter @PratinGandhi