History Repeats Itself: COPPER
We all are very well aware of the basic principle of
technical analysis is that the history tends to repeat itself. The crowd cannot
change their motivation overnight it means the people are expected to react the
same way to a certain situation as they did in past the same certain situation.
If we think based on technical analysis context, the market
is driven by the mass psychology. And the randomness of price movement in the
market is the consequence of greed and fear, pain and pleasure. So sometimes
price movement react exact the same way as it has reacted in past on particular
occasion.
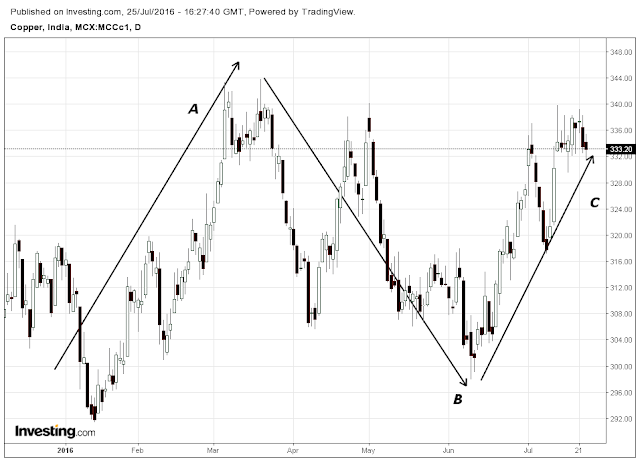
Below is the copper daily chart representing three waves
these are wave-A, wave-B, and wave-c .The pivot point or the start point of
wave-A is 13th Jan 2016 and its price ranging from 291 to 343. After achieving
343 price level wave-B has started and it seems to be irregular flat correction
structure. Now the low at 9th June 2016 is may be the end of wave-B and the
same point can be considered as the starting point of wave-C.
The purpose of this article can be fulfilled by the picture
given below, we can easily identify the wave-C is being traded and yet to be
finished. it has very high probability to illustrate the same pattern or move
,exact the same way as price reacted during the completion of wave-A.
Now take a look at bigger picture, here is the weekly Copper
chart. We can see the movement of price has channelized itself and moving
downward since Aug 2013. Channelize prize moment on the chart is always a very
useful tool to understand the price movement dynamics as once the channel has
been established its both upper and lower price line react as support and
resistance level. As illustrated in the picture, the Copper price has failed to
break lower trend line in Nov 2015 and bounced back. It has again retested in
Jan 2016 and failed again.
The reason behind this bigger picture view only shows you the
price has taken the support of lower trend line and now it is heading towards
the upper line of the channel. In simple words, price moment is repeating
itself the same way of past wave-A and it has very high probability to make
zigzag (AB=CD) structure.
Let's zoom into the hourly time frame, here is the clue which
is supporting this thinking and showing the bullish sign on charts. The
implications of an inverted Head and Shoulder pattern is bullish and it’s both
neck and shoulder line work as resistance and support for the price
respectively.
CONCLUSION: It is always the right choice to follow the flow
of greed or fear, in other words, traders should always make an educated choice
while investing money into the market and one should follow the trend of mass
psychology. The probability of traveling copper price more than 350 is very
high as above charts somehow indicating the wave-A is repeating itself and
heading towards the upper trend line of the channel.


Comments
Post a Comment