Posts

NICKEL:PATTERN INTERPRETATION
Image
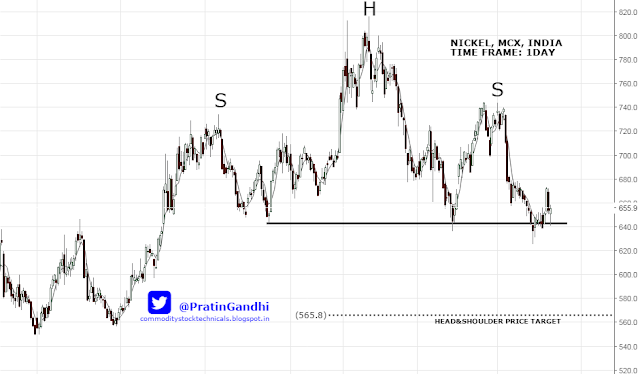
Nickel price chart formed 8 months long Head & Shoulder reversal chart pattern with very strong horizontal support standing near 640 levels. Evidence of H&S at the top can be considered as a bearish signal. Almost eight months long H&S top price target stands near 565. A short trade can be entered at the weekly close below 640 levels.                                                         From the charting perspective, there are several more bearish interpretation of the current price action. As per wave principle, an Impulse of five waves and a correction of three waves have been completed and another five wave impulse or a set of two correction waves can be anticipated . OUTCOME( POSTED ON 2ND JUNE 2017):

COPPER:WAVE ANALYSIS

Image
The Expanding Triangle. The above picture can be the real-time example of Expanding Triangle. Copper is trading sideways since January 2017 Right now The "e" wave is being traded and might end up near 382-384 levels. The major trend is up and it might be initiated after completing the "e-wave"

Crude Oil:Wave Analysis

Image
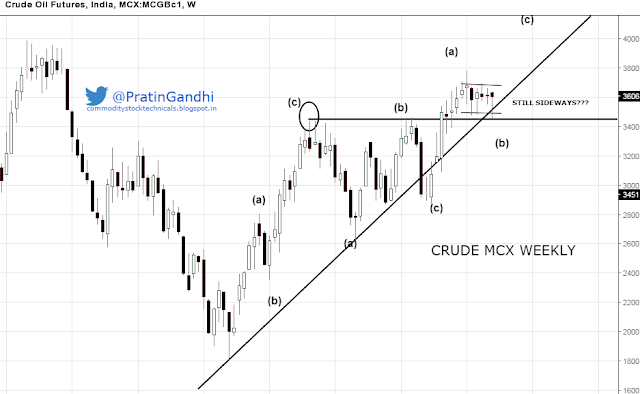
The graph given below can be the most probable wave count for Crude Oil (MCX India) in the Daily timeframe. The major trend of Crude Oil is likely to be up.  The current trend might be down and might be going towards 3440-3400 levels. The sub-wave (B) can be ended near 3440 to 3400.Check these levels if Price continue to go down Check the breakthrough at upper line of the consolidations if price go upward without testing the given levels   

Aluminium- Wave analysis

Image
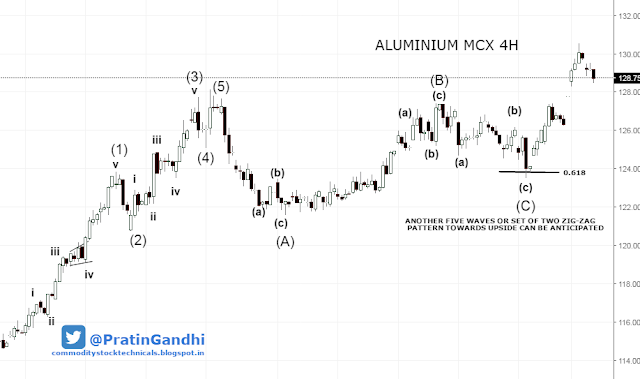
The picture given below can be the most probable wave count for Aluminium (MCX India) in the 4H timeframe. Aluminum is in up trend and heading towards 132-135 levels. Five waves or set of two zig-zag patterns can be evident very soon Every dip can be a good opportunity to buy. 

Important levels :Silver

Image
In weekly time frame, we can notice two hindrances for upcoming price movement.One strong resistance is last Dynamic level and one is trend line.Elliot's wave analysis is extremely subjective and at this stage, the market is not giving enough clues to get the exact market position.But somehow we can manage to trade with this important levels. See the Daily Silver chart for other important levels(Attached below).That might help you to plan a successful trade. Subscribe to my blog and receive a free email when I post. 

Technical outlook- Crude

Image
Crude price has reacted against the Dynamic support and Trendline support.Can we consider this move as strong bull rally? I think we should wait for another clue that might appear at the upper line of that sideways correction . Read complete article based on technical analysis  Elliot's wave analysis: Crude oil

Elliott wave analysis:Aluminium

Image
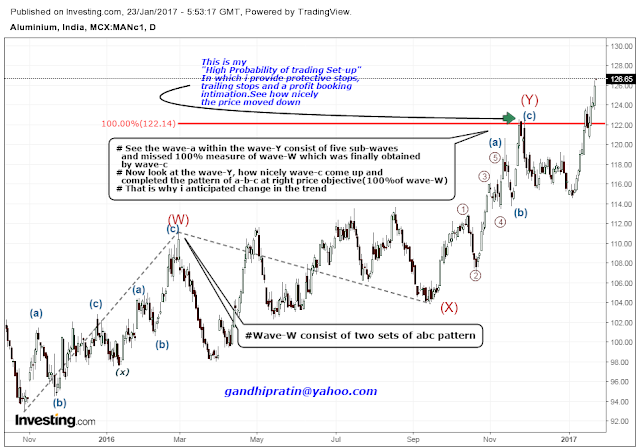
Trading using wave principle is much advantageous and has numbers of other benefits than other indicators that   usually fall   short to understand the current market activity over a larger degree trend. The wave study also   determines   the current trend of any instrument and gives the idea   whether   the trend has just initiated or being traded in intermediate stage or it has been matured. The next graph is the classic example of   Aluminium in which high degree of complexity is simplified by wave principle. See the last high which was made on 23 rd Nov 2016 and I marked as the label (Y). I anticipated that the price will come down after testing the level around 122.15 and also expected the trend will permanently change and it will not come back to taste 122.15  again. I explained in the next chart why I was considering 122.15 level was the reversal point.                     ...

Follow me on Twitter @PratinGandhi