Posts

Showing posts from January, 2017

Elliott wave analysis:Aluminium
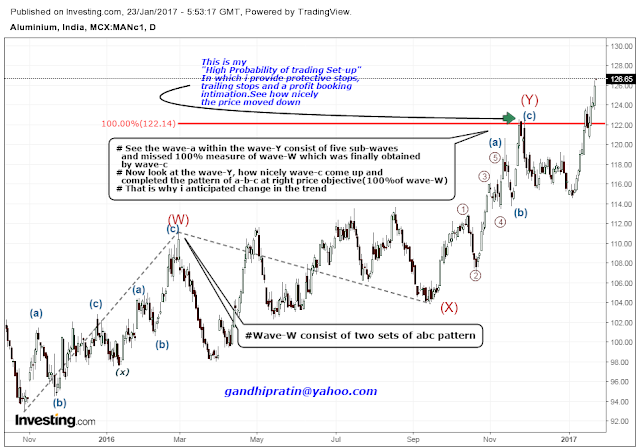
Image
Trading using wave principle is much advantageous and has numbers of other benefits than other indicators that   usually fall   short to understand the current market activity over a larger degree trend. The wave study also   determines   the current trend of any instrument and gives the idea   whether   the trend has just initiated or being traded in intermediate stage or it has been matured. The next graph is the classic example of   Aluminium in which high degree of complexity is simplified by wave principle. See the last high which was made on 23 rd Nov 2016 and I marked as the label (Y). I anticipated that the price will come down after testing the level around 122.15 and also expected the trend will permanently change and it will not come back to taste 122.15  again. I explained in the next chart why I was considering 122.15 level was the reversal point.                     ...

HIGH PROBABILITY OF TRADING SET-UP: NIFTY

Image
Once again I am bringing you a detailed study based on Elliot wave analysis and a very high probability of trading set up of Nifty. This type of article will give you an opportunity to take a low-risk trade well in advance with the greatest probability of success. Take a look at the pictures given below which is self-explanatory. The pattern which had been occurred after getting Dynamic support and 50% Fibonacci ratio seems like a running flat pattern. This pattern is evident after two sets of ABC correction and such type of running correction implies a strong continuation of the trend that is down trend. Above picture gives a clear idea about pattern interpretation, see the flat structure which indicates trend continuations. Means, when this flat structure will end the price reversal is highly expected. Look at the next graph which is showing the hindrance that may push back the price or hold the price in sideways. ...

Follow me on Twitter @PratinGandhi